|
The Earned Schedule Exchange
|
March 2, 2024
The Smell of Dysfunction
|
Project Controls and the Smell of Dysfunction

It’s popular in some Agile circles to diss controls such as Earned Value Management (EVM).
Example: “Artificial measures such as EVM typically prove to be overhead at best, whose only value is to cater to the dysfunctional bureaucrats infesting many organizations.”
Nonsense! EVM and Agile are more than compatible—they are complementary. Consider how Earned Schedule adds value to Agile schedule control.
Burndowns are commonly used to communicate project performance. Adapt them to EVM. Compare the schedule earned to the planned burndown.
If the ES line is above the plan line, you’re behind schedule. If it’s below, you’re ahead of schedule. That gives you a quick reading on schedule performance.
And, that helps control schedule performance while leveraging your investment in Earned Value.
Does that smell? Yes, the sweet smell of success.
*Follow us at ProjectFlightDeck on LinkedIn. For videos on how to use Earned Schedule, see EarnedScheduleAcademy on YouTube. . And, when you’re ready, sign up for ProjectFlightDeck Express. |
January 31, 2024
The Coconut and the Guava: How Not to Plan a Sprint
|
“Humans s**k at estimating in absolute terms but are much better estimating in relative terms.” *

Coarsely put, but a ubiquitous opinion in the Agile community. What’s the evidence for the claim?
Even the Agile Alliance admits it’s weak: “…there is a persistent claim in the Agile community that research in the psychology of planning shows that people fare better at relative than absolute estimation; in fact, the grounding for this claim is at best, tentative.”*
For proof, we’re left with anecdotes. Supposedly, they show how easy and reliable it is to estimate by comparing objects of similar size.
My favorite “proof”: the coconut and the guava. The author claims that it’s easy to use a guava as a reference and say that the coconut is about four times bigger.*
Huh? Many of us from the “high north” don’t find it so easy. Coconuts, yes; but guavas? Four times? Not so much. It’s not like we see them every trip to the 7-Eleven.
Relative estimates require common background knowledge.
That’s a slippery slope. It express beliefs about size. Whatever immediate access I might have to my belief about size, I don’t have the same access to your belief. Do we mean the same thing when we say that a coconut is four times bigger than a guava?
Maybe I’m thinking of volume rather than diameter. To me, the coconut would be 64 times the size of a guava. Or, perhaps you’re thinking of surface area, in which case the difference would be 16 times.
A dialogue might eventually disambiguate the comparison, but the process is not as straight-forward as portrayed. This is especially true when the object is more abstract than a coconut, for instance a user story.
Want to plan your next sprint? Avoid the pitfalls of relative estimates. Rely instead on absolute numbers such as Earned Schedule’s duration estimate.
It’s an absolute number based on absolute numbers. It uses current performance to estimate finish date. And, it can be compared to allowances for uncertainty—again, specific numbers.
Is it better for planning your next sprint? Absolutely!
* For references, see below. Follow ProjectFlightDeck on LinkedIn. For videos on how to use Earned Schedule, see EarnedScheduleAcademy on YouTube. And, when you’re ready, sign up for ProjectFlightDeck Express.
References:
http://chase-seibert.github.io/blog/2016/05/13/agile-points-vs-hours.html
https://www.agilealliance.org/glossary/relative-estimation/#q=~(filters~(postType~(~'page~'post~'aa_book~'aa_event_session~'aa_experience_report~'aa_glossary~'aa_research_paper~'aa_video)~tags~(~'relative*20estimation))~searchTerm~'~sort~false~sortDirection~'asc~page~1) |
January 15, 2024
A.I. vs. H.I.
|

It’ll take time to sort out the best way to use Artificial Intelligence for schedule management. In the meantime, why not use a technique that was sorted out decades ago?
Earned Schedule was first published by Walt Lipke in 2003. It offers superior measures of past performance and future duration, as shown by simulation studies, empirical research, and statistical analysis.*
More relevant for those of us with boots on the ground, ES works. I’ve used it successfully on projects and programs, large and small.
Plus, there’s freeware and commercial software that act as accelerators and force multipliers. The tools have also stood the test of time. I first introduced ProjectFlightDeck products in 2007.
Even though I’m a vendor, l believe that it’s not just whiz-bang tools that make the difference. They’re great for outputting numbers, but it’s Human Intelligence that transforms output into action. Long live H.I.
What do you think?
* For videos on how to use Earned Schedule, see my YouTube channel, EarnedScheduleAcademy. And, when you’re ready, sign up for ProjectFlightDeck Express.
References:
Crumrine, Capt Kevin (USAF) & Lt. Col. J. D. Ritschel, PhD. “A Comparison of Earned Value Management and Earned Schedule as Schedule Predictors on DoD ACAT I Programs, The Measurable News, 2013 Issue 2
Lipke, Walt. “Further Study of the Normality of CPI and SPI(t),” PM World Today, October 2011
Vanhoucke M., S. Vandevoorde. “A Simulation and Evaluation of Earned Value Metrics to Forecast Project Duration" Journal of the Operations Research Society, Volume 58: 1361 - 1374, Issue 10 (October 2007) (Note – the article is made available on-line at a cost of $10 using the following URL: www.palgrave-journals.com.) |
December 12, 2023
Earned Schedule and Michael Jordan
|
Earned Schedule is great for project control…

…that’s like saying Michael Jordan is a great basketball player.
He’s much more: an entrepeneur, a philanthropist, and a cultural icon.
No doubt, Earned Schedule helps project managers and schedulers control schedule performance.
But, like MJ, ES is also good at other things. Such as communication.
The ES Burndown is easy to understand. It de-escalates emotional reactions. And, it promotes rational decision making.
Sound good?
Get the picture with ProjectFlightDeck Express—the video shows how.
More videos at EarnedScheduleAcademy on youtube.
https://www.youtube.com/channel/UCj0Zhm6z5nI_kUcAkYh5WQw
Express product info: https://pfd-express.azurewebsites.net.
Please follow us at ProjectFlightDeck on LinkedIn.
https://www.linkedin.com/company/79783108/admin/feed/posts/ |
October 20, 2023
Bad Things Can Happen to Good Projects
|

Sometimes, it’s random factors: on one data-center project, prairie gophers chewed through a power cable, the backup generator failed, a critical test crashed (no joke, it really happened).
Other times, it’s human factors: on its maiden voyage, the flight crew requested fuel in pounds, the ground crew loaded fuel in kilograms, the plane ran out of gas mid-air (the “Gimli glider”).
One defense is uncertainty allowance. Wait for the bad things to happen, and use the allowance to recover.
A second defense is to go looking for the bad things before they strike.
That’s where Earned Schedule fits in.
It acts as a DEW line, detecting and warning of problems early, while there’s time to respond.
- Estimated End Date: as the estimate approaches the planned date, the need for action rises.
- Future Performance Rate: as the index closes on the threshold value (1.1), action must be taken before it’s too late.
- Statistical Analysis: as a trend rises toward the high bound, it calls for a quick response.
Usually, the metrics re-enforce one another and our expectations.
Occasionally, they send mixed signals and undermine our expectations.
When that happens, don’t ignore it. Treat it like the foreshocks that precede an earthquake—a fair warning. |
July 31, 2023
Give Probability a Chance: ES Statistical Analysis
|
Give Probability a Chance: ES Stats in Action

Statistical variance is not just an academic exercise. You can apply high and low bounds to actually manage schedule performance.
Here's how.
Start with the nominal Estimate at Complete for time (ES/SPIt). Find the high and low bounds of the estimate.
(The math behind the calculations is daunting. Save time and headache by using an app. Both freeware and commercial software are available to do the calculations. For info on ProjectFlightDeck’s solution, click here.)
Now, look for trends. What's a trend? It's three or more consecutive measurements headed in the same direction.
What does a trend tell you?
For Walt Lipke, the direction of the trend tells you the likely duration, given historical performance on the project.*
Here’s a trend we like to see: high and low bounds converge symmetrically on the nominal. The nominal, in turn has a flat trajectory. The interpretation: estimates will be fairly close to the actual outcome. No further action is required.
By contrast, here's a pattern we don't like to see: high and low bounds suddenly diverge. That means performance is erratic. The estimates are not reliable indicators of final duration. As soon as the trend emerges, take action to recover the project.
If there is a synchronous downward trend, that means performance is improving over time. The low bound will be slightly lower than the actual outcome. That's often viewed positively, but it has a downside. It might indicate padding in the schedule. Maybe, it's time for action.
Finally, see if there is a coordinated upward trend in the estimates. That means performance is worsening over time. The high bound will likely end up slightly higher than the actual outcome. Again, maybe it's time for action.
When performance is stable, trend analysis signals the likely outcome. But when does the signal call for action? Too early, you lose credibility. Too late, you lose recoverability.
For an answer, you need two things.*
First, the performance baseline. That's the Planned Duration. And, second, performance thresholds—limits of acceptable performance.
One form of threshold is a fixed percentage of the Planned Duration. It's usually set by governance documents, project or program plans, or contracts. In our practice, we have used ±10% as the fixed rate.
Another form of threshold is a variable percentage. In our practice, it's derived from uncertainty allowance.
Uncertainty leads to risk, and the risk needs to be mitigated. Some uncertainty arises from a lack of knowledge. It creates reducible risk. You buy down the risk with scheduled tasks that fill in knowledge gaps. Contingency covers the buy down.
Uncertainty also arises from the randomness that occurs naturally on projects. You can't buy down that kind of risk. It's irreducible. You can only buffer it through Reserve.
Add or subtract the uncertainty allowance to or from the Planned Duration. That sets performance thresholds.
Next, assess the variance of estimates from the baseline (or the total commitment). If the variance trends towards a threshold, prepare to take action. If the variance breaches a threshold, it's time to act.
Finally, use high and low limits to assess the reliability of the nominal estimate. A wide range means you should be cautious about depending on the nominal. A small range, especially later in a project, warrants more confidence in the nominal.
Watch for our video, Marie Gives Probability a Chance. It drops next week.
*References:
Videos: Making (Common) Sense of ES Statistical Analysis
Building Blocks
Build the Bounds
Apply the Bounds
Blog:
Statistical Analysis Revisited (2021)
Statistical Analysis Deep Dives
Background
How it works
Steering the Project
Example
Pro/Con |
July 31, 2023
PGCS Webinar: 6 Yancy Qualls Yancy Qualls ES vs. IECDs Showdown
|

After introducing himself, Yancy set his challenge: which is better Earned Schedule’s Estimated Completion Date (ES) or an Independent Estimated Completion Date (IECD) derived from BCWS* and BCWP?
Yancy noted an asymmetry between reactions to cost and schedule forecasts. If in years 1 and 2, the BCWP=200K and ACWP=246K, the cost variance is -46K. If in years 3 and 4, the BCWR=200K and estimate for completion ETC=153K, the cost variance is +46K. Credible? No! Nobody would believe that you’ would close the gap and that the project would finish on budget.
On the other hand, if the Critical Path showed a current lag of 57 periods from the baseline but most of the schedule remained available, the planned finish would likely remain intact. Many would accept that the time could be “made up” before the planned finish.
Optimism bias makes actual data from projects unreliable. We cannot trust claims that the estimated finish is still in place.
Instead, Yancy proposed to determine which duration estimates were reliable. That presented another challenge.
EAC and ETC metrics are mature, offering several formulas. We can identify the formula that best fits. By contrast, IECD calculations are not as mature, and we don’t know which has the best fit.
So, Yancy built a simulator that performed several types of IECD calculations simultaneously. That enabled him to compare the results to those from ES’ EACt.
Yancy’s IECD calculations*:
• BCWS-based: IECD = Time Now + BCWR / BCWS(current or average)
• BCWP-based: IECD = Time Now + BCWR / BCWP(average)
• SPIt-based IECD = Time Now + PDWR / SPIt(current or average)
• SVt-based IECD = Time Now + BL Complete + SVt
• CP-based IECD = CP finish = BL Finish
To make the simulation more realistic, Yancy added variations in start and end dates, ramp up and down, slower and faster rates, smoother and rougher curves. He also varied project length, took data from different points in the project timeline, and varied the size of the window.
Yancy demonstrated the simulator, looping through several scenarios. In each run, the generated estimate that came closest to the given end date was measured and stored.
What were the results of his investigation?
Yancy reported that SPIt was “almost always” the best, and SVt was the next best. The worst performer was the BCWS-based estimate. The most stable was the SVt.
Yancy’s conclusion was that schedulers should use and report ES and the EACt (which is based on SPIt).
* Acronyms used in this report: BCWS=Budgeted Cost of Work Scheduled, aka PV; BCWP=Budgeted Cost of Work Performed, aka EV; BCWR=Budgeted Cost of Work Remaining; PDWR=Planned Duration Work Remaining; BL=Baseline; CP=Critical Path; EACt=Estimate at Complete for time; SPIt=Schedule Performance Index for time; SVt=Schedule Variance for time. |
July 1, 2023
PGCS Webinar: Paulo André de Andrade The PL Categoriser
|

Paulo became aware of Earned Schedule in 2007 through course work on his master’s degree. With expertise in technical translation, he translated some of Walt Lipke’s articles and both of his books into Portuguese.
Paulo published articles and gave presentations on Earned Schedule. Some Brazilian companies began using ES, but adoption has been slow. Once use of EVM increases, ES adoption will increase.
Paulo developed Abacus, an Excel spreadsheet, to serve as a demo and instructional tool for ES. It’s available for download from Walt’s Earned Schedule website.
Paulo then developed an executive project reporting service through his company Techisa Abacus. It features an Excel/VBA application that performs ES analysis and presents results in tabular and graphical form.
Paulo conducts research on ES. He’s pursuing a Ph.D. with Prof. Mario Vanhoucke at Ghent University. Paulo’s research focuses on determining the reliability of a project’s forecasted completion. He’s exploring whether or not the shape of the Performance Measurement Baseline (PMB) affects estimate reliability.
Paulo proposed a reliability categorizer based on the PMB shape. First, he created a measure of schedule topology: the degree to which the schedule is serial (S) or parallel (P).
Next, he introduced Batselier and Vanchoucke’s Regularity Indicator (RI). Projects with higher RI yield better forecast reliability than other projects. And, they are more accurate than the SP indicator.
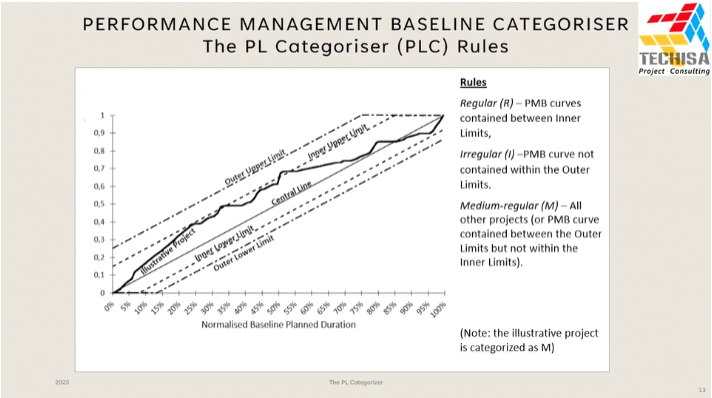
Paulo combined SP and RI to produce a third categorizer, the PMB Limits Categorizer (PLC). Rather than taking a theoretical approach, he pursued an empirical one. He used empirical data and statistical analysis techniques to identify limits for the PMB curves.
Regular (R) PMB curves were contained within Inner Limits. Irregular (I) PMB curves fell outside the Outer Limits. All other curves were called Medium-regular (M). The position of the PMB curve within the limits was determined by its deviation from a central line.
Paulo used the Batselier and Vanhoucke repository of real project data for his research. He extracted 100 projects out of the 133 projects in the data base, using selection criteria developed by Vanhoucke and Martens. He normalized the data and used statistical analysis to identify the central line. From this, he constructed the limits and moved to categorize projects.
Paulo used real data to test the approach. The average curve for the data had an unexpected shape. Rather than an S-curve, it approximated a straight line (with some irregularities). Construction projects constituted 75% of the sample, and they are known to be mostly serial. That accounted for the shape of the curve. And, they became the focus of his additional research.
Paulo applied statistical techniques to smooth out irregularities in the construction data. The smoothed line was the basis for the limits. They are placed at a fixed distance from the central line. The distance varies depending on the data, and a single parameter is used to control variation in the calculations.
Given the limits, Paulo partitioned the sample projects into R and I categories. Further statistical analysis produced a measure of “forecasting goodness”.
Applied to the sample, the categorizers were ranked. PLC showed the best results in categories balance, clustering quality, and correlation. Also, for the R category, the PLC showed the best mean absolute percentage error.
Conclusions: PLC is superior to SP and RI in the study. It best fits construction projects and small projects rather than large ones.
For future research: validate PLC for megaprojects, sectorize the central line and limits (once more data is available), and create guidelines for using PLC in project planning. |
May 15, 2023
PGCS Webinar: 6 Mario Vanhoeucke 20-Yr Journey in One Presentation
|

At the start of his “journey”, Mario focused on algorithms for constructing simulated schedules. He found that his students in business school were more interested in risk analysis and project control than algorithms.
In 2003, things changed. Walt Lipke published “Schedule Is Different”. For Mario, it was a “seminal” work—it strongly influenced him to move in a different direction.
First, Mario embedded Earned Schedule in his research. In a simulation study with Stephan Vandevoorde, he confirmed the accuracy of ES versus other metrics.
Then, a separate study showed that, given true scenarios, ES beat other metrics. But, for false scenarios, ES was not as good. Mario interpreted this as showing that ES is harder to mislead than other metrics. “Garbage in, garbage out” as he put it.
Another separate study showed that, in serialized schedules, ES performed well, but in parallel schedules, its results were not as good.
Around 2008, Mario researched the effect of control on project performance. He measured the effect by comparing the effort it required vs. the impact that it produced. The best combination is low-effort control and high-impact correction to recover.
Given this yardstick, he found that standard measures such as Earned Schedule worked better with serialized schedules than with parallel schedules.
From 2009-2013, Mario moved beyond the academic environment, engaging professionals in the field. He obtained a large research grant that enabled him to publish the formulas behind his work on project control.
The research showed that standard measures were “easy” and produced “good” results, whereas statistical control was “difficult” but produced “very good” results. Mario developed Analytical Project Control which was both “easy” and “very good”. He connected it to corrective actions and validated it empirically.
In 2015, Mario addressed the gap between simulated and real schedule data. The former were academic, general, and statistically distributed. The latter were professional, specific, and not statistically distributed. Data calibration performed statistical analysis of historical data and applied curve fitting and human expertise to calibrate the distribution. Calibrated data produced superior predictions.
The following years witnessed testing and evolution of Calibration. Each successive round improved the accuracy of data distribution, scaling up from 50% to 97%. In short, give the data to calibration and get back the real distribution.
And Mario’s journey continues… He and his team are researching resource skills, machine learning, protective/preventive risk control, action optimization, and contracts.
Finally, in addition to the “hard” skills of analysis and calculus, Mario foresees research into “soft” skills such as creativity and communications. |
April 17, 2023
4 Paulo André de Andrade The PL Categoriser
|
Paulo became aware of Earned Schedule in 2007 through course work on his master’s degree. With expertise in technical translation, he translated some of Walt Lipke’s articles and both of his books into Portuguese.
Paulo published articles and gave presentations on Earned Schedule. Some Brazilian companies began using ES, but adoption has been slow. Once use of EVM increases, ES adoption will increase.
Paulo developed Abacus, an Excel spreadsheet, to serve as a demo and instructional tool for ES. It’s available for download from Walt’s Earned Schedule website.
Paulo then developed an executive project reporting service through his company Techisa Abacus. It features an Excel/VBA application that performs ES analysis and presents results in tabular and graphical form.
Paulo conducts research on ES. He’s pursuing a Ph.D. with Prof. Mario Vanhoucke at Ghent University. Paulo’s research focuses on determining the reliability of a project’s forecasted completion. He’s exploring whether or not the shape of the Performance Measurement Baseline (PMB) affects estimate reliability.
Paulo proposed a reliability categorizer based on the PMB shape. First, he created a measure of schedule topology: the degree to which the schedule is serial (S) or parallel (P).

Next, he introduced Batselier and Vanchoucke’s Regularity Indicator (RI). Projects with higher RI yield better forecast reliability than other projects. And, they are more accurate than the SP indicator.

Paulo combined SP and RI to produce a third categorizer, the PMB Limits Categorizer (PLC). Rather than taking a theoretical approach, he pursued an empirical one. He used empirical data and statistical analysis techniques to identify limits for the PMB curves.
Regular (R) PMB curves were contained within Inner Limits. Irregular (I) PMB curves fell outside the Outer Limits. All other curves were called Medium-regular (M). The position of the PMB curve within the limits was determined by its deviation from a central line.
Paulo used the Batselier and Vanhoucke repository of real project data for his research. He extracted 100 projects out of the 133 projects in the data base, using selection criteria developed by Vanhoucke and Martens. He normalized the data and used statistical analysis to identify the central line. From this, he constructed the limits and moved to categorize projects.
Paulo used real data to test the approach. The average curve for the data had an unexpected shape. Rather than an S-curve, it approximated a straight line (with some irregularities). Construction projects constituted 75% of the sample, and they are known to be mostly serial. That accounted for the shape of the curve. And, they became the focus of his additional research.

Paulo applied statistical techniques to smooth out irregularities in the construction data. The smoothed line was the basis for the limits. They are placed at a fixed distance from the central line. The distance varies depending on the data, and a single parameter is used to control variation in the calculations.
Given the limits, Paulo partitioned the sample projects into R and I categories. Further statistical analysis produced a measure of “forecasting goodness”.

Applied to the sample, the categorizers were ranked. PLC showed the best results in categories balance, clustering quality, and correlation. Also, for the R category, the PLC showed the best mean absolute percentage error.
Conclusions: PLC is superior to SP and RI in the study. It best fits construction projects and small projects rather than large ones.
For future research: validate PLC for megaprojects, sectorize the central line and limits (once more data is available), and create guidelines for using PLC in project planning. |
April 17, 2023
PGCS Webinar: 3 Keith Heitzman (NASA Contractor) Interview w Pat Weaver
|

Keith has a 30-year career in project management and control. He has broad experience on large-scale projects and programs. In his current role at NASA, he is the lead scheduler on the Artemis project.
The Artemis project is well-known, given its recent successful launch. A brief video gave an overview of the project. Its immediate mission is to again set foot on the Moon—this time, on the southern pole. Its ultimate goal is Mars.
The Artemis rocket is the only one that’s capable of sending people into deep space. The rocket generates 39 million newtons of thrust. [I believe that’s about 9 million pounds. By comparison, the Saturn V, the retired moon-shot rocket, had about 7.7 million pounds of thrust.]
There are six variations of the Artemis rocket. Planning is underway for all of the variants. The size of the planning effort is formidable: 150K activities at the summary level! The plan is broken up by components.
A second video explained the mission further. It was summed up by a phrase that echoes Apollo 11:
"We came in peace. We return for all humanity.”
Keith then described his role as lead scheduler for the Space Launch System (SLS). He oversaw the summary level schedule. Keith noted that the schedule did not include contractor details.
Keith’s company provides over 200 controls specialists to NASA. In his role, Keith brought to bear his experience in large construction projects. Through one of those projects, he had contact with SpaceX. Helping SpaceX plan the testing of their project led to his work for NASA.
Keith then addressed Earned Schedule’s fit into the overall controls paradigm on Artemis.The prime contractor on the Critical Path reported the BCWS and BCWP in labour hours, not dollars. The numbers did not match the contracted schedule.
Keith’s team tracked ES week by week. They used ES predictive metrics. And, they fed the ES metrics into Monte Carlo analysis for comparative estimates. They found the ES numbers to be highly accurate.
Keith noted that the difference between accounting and project control/engineering: it’s the difference between an historian and a fortune teller. One lives in the past, the other in the future.
Keith finds the math behind ES simple, but he says that it still yields good information. He sees the current use of ES as a test bed for other projects, as it offers a model of practice and is supported by tools and techniques.
For the future, Keith sees a need to move beyond the hard skills of scheduling to the soft skills of working with teams and communicating results. |
April 4, 2023
PGCS Webinar: 2 Kym Henderson Validating Earned Schedule, Research and Studies
|

Kym recounted his history with Earned Schedule.
Kym first became aware of ES through the Measurable News. He read Walt Lipke’s 2003 article, “Schedule Is Different”, and noticed that there was information missing. (Later, a corrected version was published.)
Kym contacted Walt, requesting the missing pieces. That led to an offer to test the theory on his project archive. Kym went on to publish early confirmation of the theory. While doing so, he criticized existing measures as “algebraically flawed”. That, he speculated, might have inspired early debate on ES.
Despite the debate (or, perhaps, because of it), adoption of ES was quick: in 2005, PMI-CPM identified ES as an emerging practice. Since then, ES has been featured in the following:
- a PMI EVM Practice Standard
- an NDIA-IPMD Guide
- an ISO EVM Standard
- an Australian National Standard
- an ISO Implementation Guide
Earned Schedule is used in government programs, studied by academics, supported by tools, translated into multiple languages, and made available for use and distribution without charge.
Over time, it seems that the debate on ES credibility has shifted to a debate on whether it is an “add on” to EVM or simply part of EVM.
Why has Earned Schedule been successful? Kym’s view is that first, and foremost, it works!
- It requires no additional data collection beyond Planned Value and Earned Value.
- It tells the likely finish date for a project.
- It can be used at different skill levels. It offers simple metrics for past performance and likely future outcome and advanced metrics for project recovery, schedule adherence, and statistical analysis.
- ES still ties back to EVM basics, closely aligning with familiar EVM terminology.
- Finally, ES enjoys empirical validation, both by practitioners and academics.
Kym concluded by commenting on Walt Lipke.
He applauded Walt’s commitment to placing ES in the public domain, rather than making it proprietary.
Kym believes that ES has not been oversold, as has happened with other techniques. It has relied on control-professionals to make their own decisions on adoption. And, it’s been responsive to their comments and critiques.
It was Walt’s “brilliant insight” into the relation between PV, EV, and time that has powered ES.
To Kym, it’s been a “wild ride” that has benefited him personally. He’s proud of his role in ES and its achievements. |
March 27, 2023
PGCS Webinar: Recap
|
|

On March 8, 2023, the Project Governance and Control Symposium (Australia) hosted a Webinar to mark the 20th Anniversary of Earned Schedule.
It was in 2003 that Walt Lipke published "Schedule Is Different" (Measurable News, March & Summer). It sparked two decades of research, development, and implementation.
The Webinar brought together 8 experts on Earned Schedule. Over a period of four hours in two separate showings, the experts covered a broad diversity of topics.
Some focused on the history of Earned Schedule. Others concentrated on its practice, showing how ES is being used to control both traditional and Agile projects. Still others captured the results of research efforts, both academic and informal.
What emerged was a picture of a vibrant, growing community of use and support for Earned Schedule.
In this series of posts, each of the presentations is recapped.
|
March 27, 2023
PGCS Webinar: 1 Walt Lipke ES, 20 Years of Innovation
|

Walt acknowledged the global contribution to the development and furtherance of Earned Schedule over the past 20 years.
He followed with a brief history of how “thinking different” led him to Earned Schedule.
- At the start: successful (and unsuccessful) application of EVM
- Difficulty applying Statistical Quality Control to projects—lack of appropriate data
- Shortfalls in the use of EVM’s SPI
- Functions didn’t fit EVM’s “smooth performance curves” [PV and EV]
- But, the curves could be viewed as a collection of discrete points
- That is, a series of accumulated data—the sums of Planned Value and Earned Value
- A key insight: Earned Value could be mapped to Planned Value to determine the amount of Planned Duration that was earned
- Big question: what to do when the duration earned did not align exactly with a period end
- Trigonometry to the rescue: proof that cost values are proportional to time values
- Deduction of the ES formula: ES = C[omplete] + I[nterpolation], where C equals the periods in which EV >= PVC and I= (EV-PVC)/(PVC+1-PVC)
Walt confirmed the theory with empirical studies. Moving forward, he “built on the new, rather than fighting the old”.
Walt then gave an overview of Earned Schedule’s use.
There are performance indicators and outcome forecasts. There are metrics for project recovery and measurements of schedule adherence. There’s statistical analysis of past performance and estimates of future impacts.
The metrics can be used to manage the current schedule and plan future schedules. As time goes on, you can build an archive of results. You can use them to improve your schedule execution and planning.
Walt noted that there are resources available for learning and applying Earned Schedule. They include study guides, videos, and tools.
Walt’s expectation is that, with greater awareness, application of Earned Schedule will grow.
Final thoughts.
Advanced ES Practices, such as schedule adherence and recovery analysis, will be adopted increasingly. He warned against segregating cost, schedule, and technical performance. And, he noted that control systems outside of EVM are already moving in that direction, but in doing so, they end up creating EVM-like systems.
By contrast, Walt sees EVM plus Earned Schedule continuing to power project control. |
|
Archives |

